Innovative application “Biodiversity Bird Indicator” as part of
ENERGIC – European NEtwork for Redistributing Geospatial Information to user Communities
-
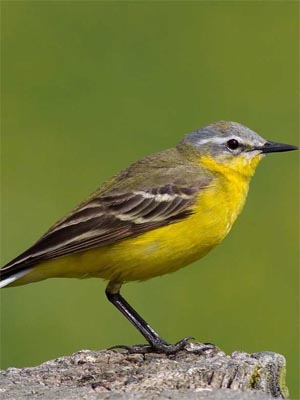
- Wiesenschafstelze
-
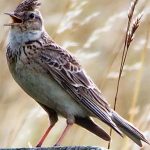
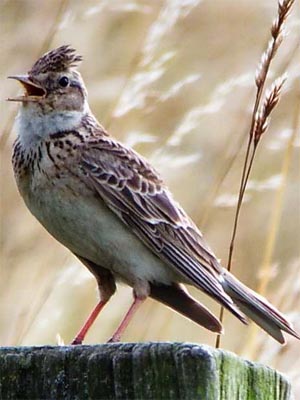
- Feldlerche
-
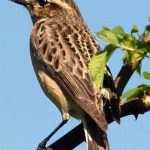
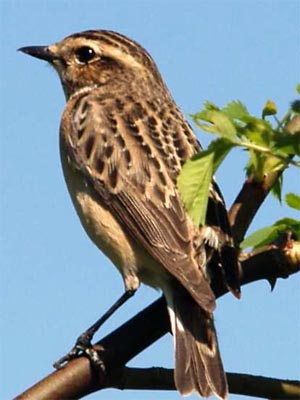
- Braunkehlchen
Alongside climate change, the loss of biodiversity is one of the most urgent environmental threats of our time (EU biodiversity strategy COMM 2011). The main cause is the destruction, alteration and fragmentation of habitats. Covering 210 million hectares of arable and pasture land, almost half of Europe’s land is used for agriculture. The intensification and industrialization of agriculture practice has led to a dramatic species and biodiversity loss. The agricultural bird indicator (Bird Census Council 2012) shows a decrease in agricultural bird numbers by 52% since 1980. In Germany, the “biodiversity and landscape quality” indicator as part of the German National Strategy on Biodiversity (BMU 2011) also points out this negative trend.
The new EU-Commission strategy is to reduce the loss of biodiversity by 2020. The introduction of the CAP reform in 2014 shall promote the conservation and enhancement of biodiversity.
The goal of the project is to create an interactive platform for agrobiodiversity to provide everyone involved in the implementation of the new reform (in particular with the so called “Greening” measures) with information and assistance for a ecologically worthwhile implementation.
The aim of the project is to develop a standardized automated process that enables an extensive and inexpensive analysis of the status of favorable/unfavorable habitat structure in agricultural areas using remote sensing data. This app also provides support for conservation measures and improvement of habitat structure. The creation of a geoportal with interactive maps will foster the communication between different users and stakeholders, such as government agencies, farmers, and NGOs.
-
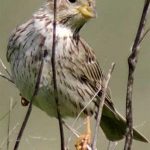
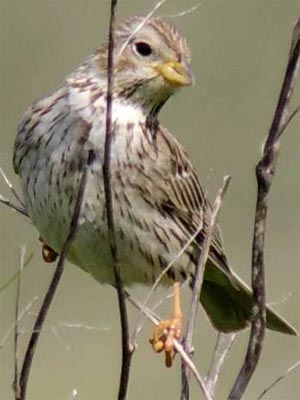
- Grauammer
-
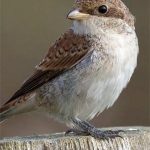
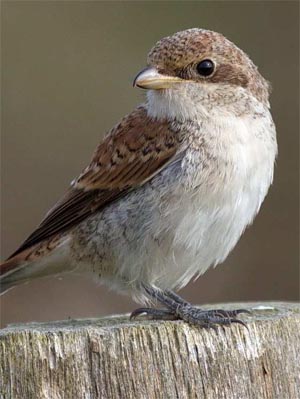
- Neuntöter
-
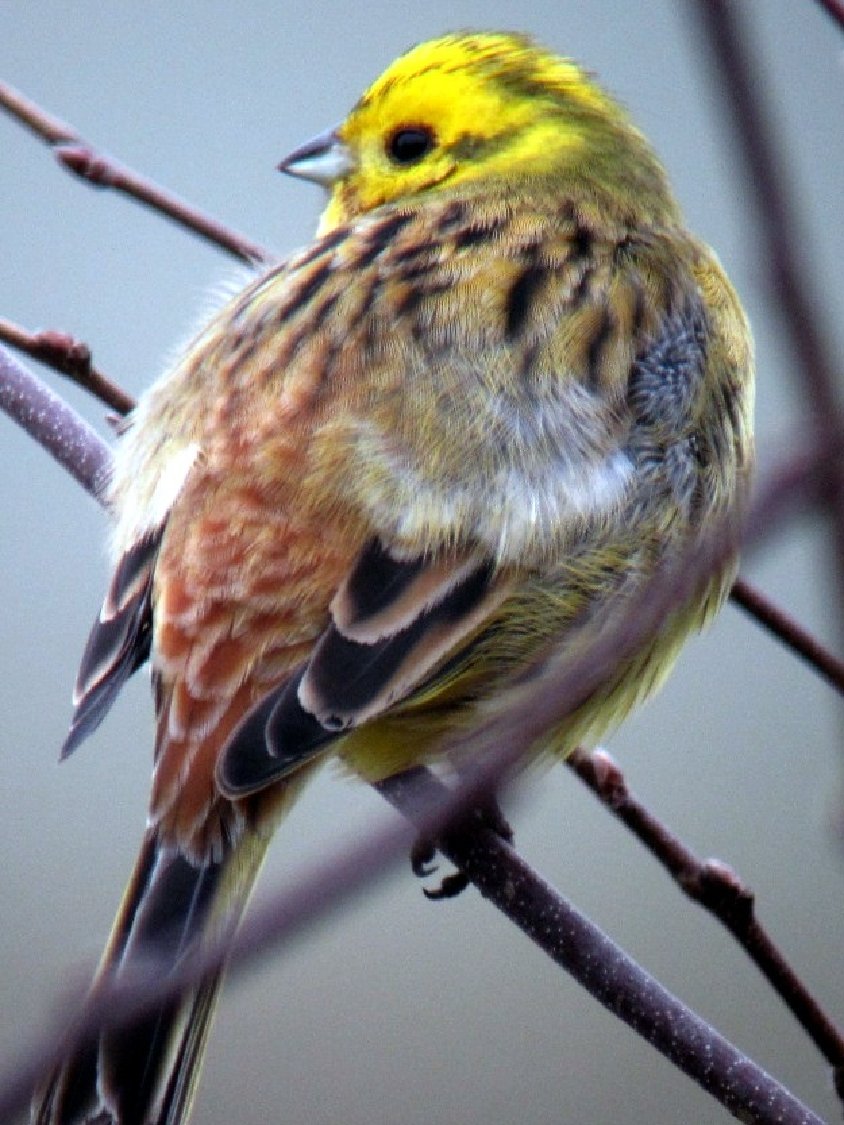
- Goldammer
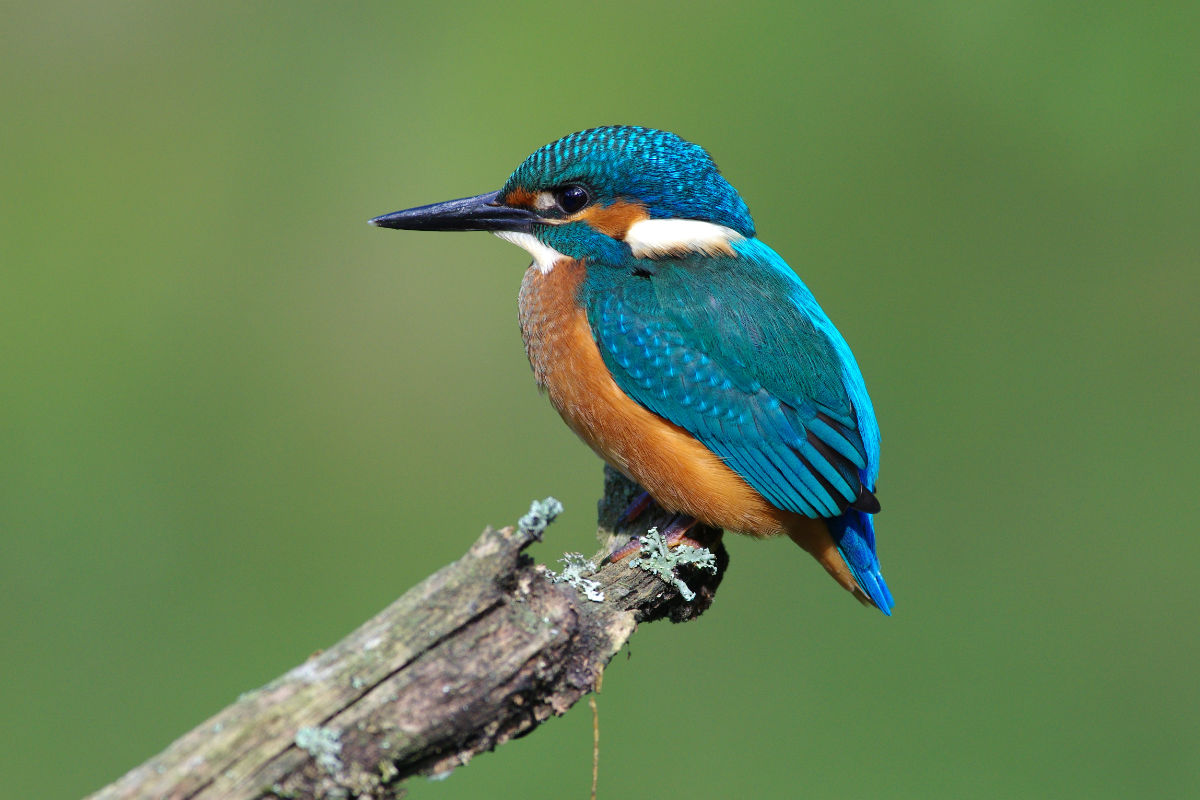
In detail, habitat requirements of selected bird species such as Skylark, Corn Bunting, Yellowhammer, Yellow Wagtail, Whinchat and Red-backed Shrike (e.g. Hoffmann et al. 2012) will be extracted to satellite remote sensing data. Remote sensing is a promising approach for the development of high quality, but cost-effective and comprehensive methods for landscape information. High-resolution multi-temporal satellite data will be applied for the analysis of the habitat requirements, such as the size and nature of the crop fields, and semi-natural habitats as well as the general land use. Vertical vegetation structures can be described with stereo images and the intensity of agricultural use with radar data. Within this project, a standardized method for the habitat matrix analysis will be developed. At first, the test region will be Brandenburg. An expansion to Germany and across Europe is desired.
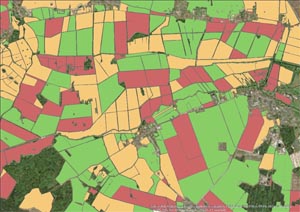
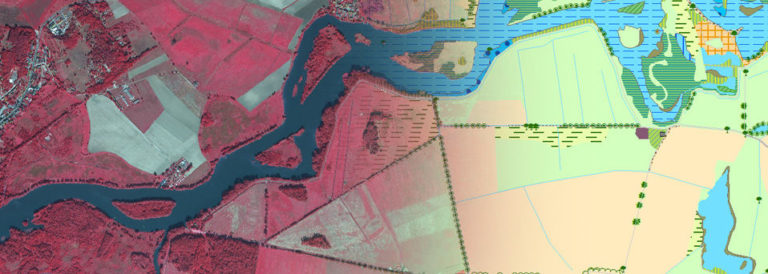
habitat suitability map
The status of habitat structures will be illustrated in form of habitat suitability maps for each species with a traffic light colouring (red = unsuitable, green = suitable) and enables a detailed view of individual areas and the derivation of possible recommendations for habitat improvements.
Results will be presented to the user via a browser-based geoportal as a map, table and chart. The geoportal allows the user to search, query and filter information temporally, spatially, and content based. In addition, data can be exported, allowing a corresponding user-end processing.
Contact:
- Helga Kuechly
helga.kuechly@lup-umwelt.de - Stefan Braumann
stefan.braumann@lup-umwelt.de - Dr. Annett Frick
annett.frick@lup-umwelt.de