On the background of climate adaptation requirements, Green Volume has become one of the mayor indices for landscape- and environmental planning. Within environmental monitoring programs, LUP applies the accurate preparation of Green-Volume-Index on the local and regional level.
The local authorities of Potsdam required the analysis of the change of the urban green volume in Potsdam since the political transformation in 1989. The urban green volume is a landscape planning parameter and is described through the green volume number (SCHULZE et al. 1984). It measures the aboveground volume of the urban green in m³/m². It plays a major role for the quality of life and the environmental quality in cities and therefore for urban management. The bigger the green volume, the stronger the effect as dust attachment, increase in evaporation, lowering of temperature, production of oxygen, shades etc. Thus green volume is of particular importance for recreation. With the indicators surface sealing and urban green volume it is possible to measure the actual condition of environment (ARLT et al. 2005).
In a first step an additional digital surface model of the HRSC of 2006 and a digital terrain model as well as a detailed classification of the vegetation were used. The height of vegetation was calculated by substracting the terrain model from the surface model. This calculated height and for some vegetation classes an assumed height (e.g. floating leaf vegetation or grassland) was used to calculate the references of the green volume.
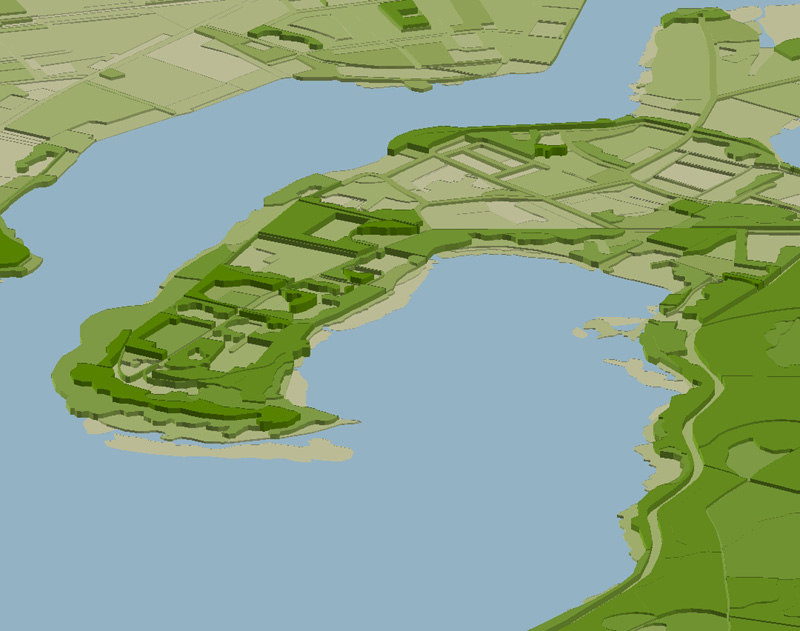
3D map of Green-Volume, example Hermannswerder
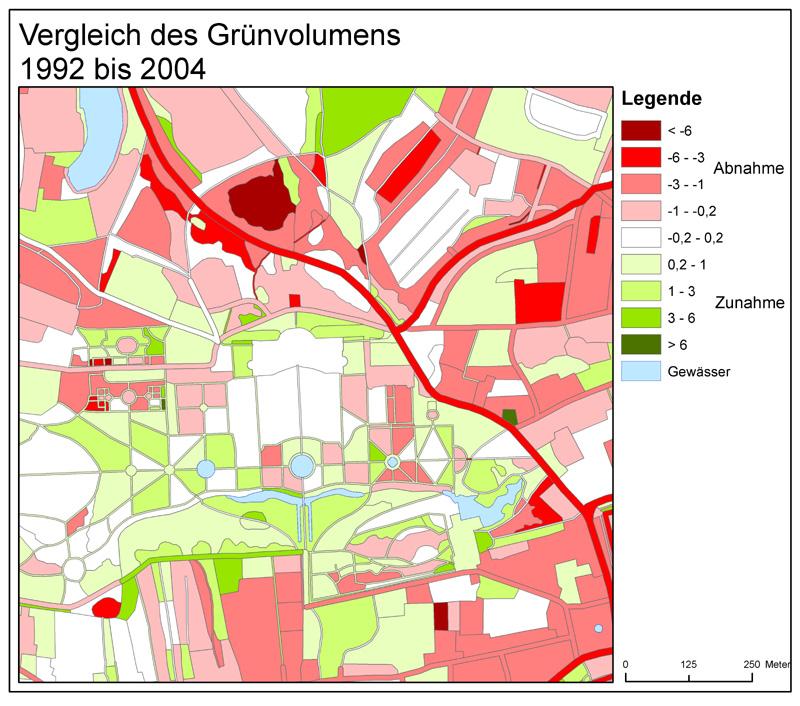
Development of Green-Volume 1992 – 2004
In a second step two regression tree models (BREIMANN et al. 1984) were realised to map the urban green volume for 1992 and 2004. Therefore available satellite and aerial imagery – digitised colour-infrared-images of 1992 and QuickBird satellite data of 2004 – were used. The urban green volume can also be analysed on the base of other remote sensing data sources e.g. by using laser scanning data (see MEINEL et al. 2006a, MEINEL et al. 2006b).
In Potsdam the urban green volume was reduced about 0.1 m³ per m² from 1992 to 2004. The figure to the right shows the change of urban green volume for an example area in Potsdam, the palace grounds of Sanssouci. In some blocks the green volume changed a lot, others did not change at all. The two models of 1992 and 2004 both had a good accuracy (correlation coefficient of 0.89 and 0.90). For a monitoring in the future it is recommended to update the reference data with new, simultaneous data of HRSC or laserscanning.
Literature:
Arlt, G., Hennersdorf, J., Lehmann, I. & Xuan Thinh, N.: Auswirkungen städtischer Nutzungsstrukturen auf Grünflächen und Grünvolumen. IÖR Schriften. Nr. 47. Dresden. 2005.
Breiman, L., Friedman, J., Olshen, R. & Stone, C.: Classification and Regression Trees. Chapman and Hall. New York. 1984.
Meinel, G., Hecht, R. & Buchroithner, M.: Die Bestimmung städtischen Grünvolumens – Nutzen, Methodik und Ergebnisbewertung. In: Strobl, J.; Blaschke, Th.; Griesebner, G. (Hrsg.): Angewandte Geoinformatik 2006. Beiträge zum 18. AGIT-Symposium Salzburg. S. 430-437. Heidelberg. 2006a.
Meinel, G., Hecht, R. & Socher, W.: Städtisches Grünvolumen – neuer Basisindikator für die Stadtökologie? Bestimmungsmethodik und Ergebnisbewertung. In: Schrenk, M. (Hrsg.): CORP 2006 & Geomultimedia06. 13.-16. Februar 2006. S. 685-694. Wien. 2006b.
Schulze, H.-D., Pohl, W. & Großmann, M.: Gutachten: Werte für die Landschafts- und Bauleitplanung: Bodenfunktionszahl, Grünvolumenzahl. – Schriftenreihe der Behörde für Bezirksangelegenheiten, Naturschutz und Umweltgestaltung Freie Hansestadt Hamburg, 9. 1. Aufl. Christians. Hamburg. 1984.